| 1. Statistical Quality Control (SQC) (OPTIONAL Module) |
| 1.1. Prerequisites for SQC | ||||||||||||
Required Prerequisites:
ManEx’s standard module configuration allows most users to accomplish their daily tasks. For those users wanting to get more from ManEx by leveraging the total solutions, this is one of the optional modules available for purchase. To place an order or to learn more about this specific module or any of the other optional modules please contact us at http://manex.com\contactus.aspx After activation, "Statistical Quality Control" (SQC) access for each user must be setup in the ManEx Security module. Users with “Supervisor Rights” will automatically have access.
Optional Prerequisites:
|
| 1.2. Introduction for SQC |
The STATISTICAL QUALITY CONTROL (SQC) Module ~ Defect Entry screen is used to record defects and inspection results during the movement of product through the production Work In Process (WIP). The user has a choice of entering data in a batch mode or in an in-line mode See Article #5113 for further detail. Batch mode is the entry of data accumulated during an inspection period, and is data entry only (does NOT transfer product from one work center to another). In-line mode is where inspection is done at the end of a work center or activity, and the product is to be moved to another work center based on the results of the inspection. In-line inspection would require inspection of 100% of the product, in order to move the product from one step to another. It also requires the use of a ManEx workstation at the inspection station, so the data may be entered real-time. Defect entry is based on having a standard nomenclature for the defects in the Quality Defect Codes setup, so that the users do not have the option of creative descriptions. The defects in the setup may be ascribed to specific work centers, to minimize the number of defects that an inspector (or data entry person) has to view to find the appropriate defect. Defect information may be recorded by work order and/or by serial number. Defects may be associated with a specific “location” (reference designator) on the assembly, providing the user has entered reference designators for the assembly in its Bill of Material . If the user chooses to enter reference designator locations for the defects, and has entered reference designators on the Bill of Materials, then ManEx will prompt the user to select the manufacturer for the part used at the location, as well as automatically enter the internal part number at that location. There is also provision for tracking the diagnostics and repair of each defect and assembly. The user may view the history of the assembly’s movement through production, and all of the defects associated with each assembly. |
| 1.3. Fields & Definitions for SQC |
| 1.3.1. Defect Data Collection |
| 1.3.2. View Chart Tab |
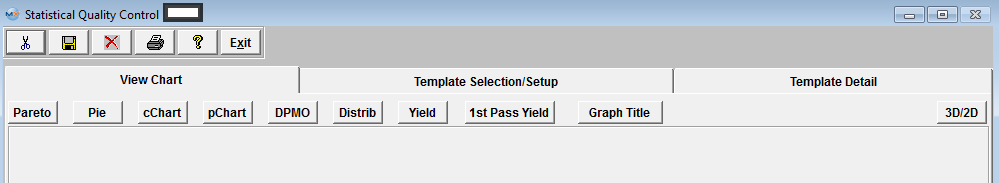 See Article #5115 for more detail on each individual Chart Listed at the Top. Once you have selected the type of graph you wish to view the graph will be displayed in the window below the selection.
|
| 1.3.3. Template Selection/Setup Tab |
Template Selection Setup
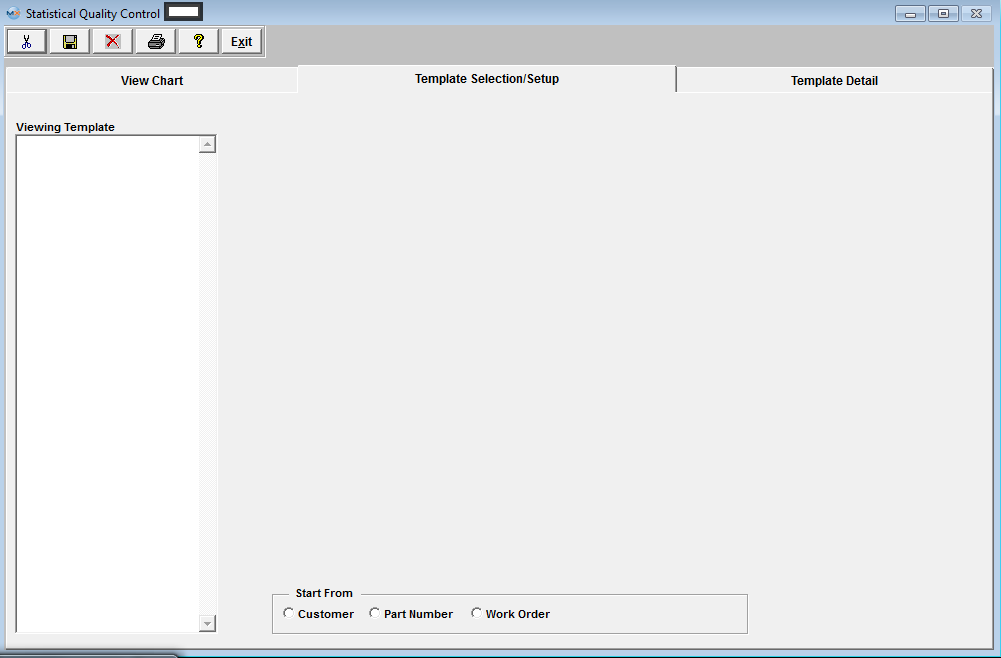 This is the first screen to be used in the module. In this screen, STATISTICAL QUALITY CONTROL graphics are created by selecting parameters to be considered in the graph. This screen operates differently than all other ManEx screens. When bringing up the SQC module, the user is first presented with a template screen from which to choose parameters to be included in the information displayed. When the user enters the system, he/she may select how they want to start the process of selection. Click on the Customer, Part Number or Work Order radial. |
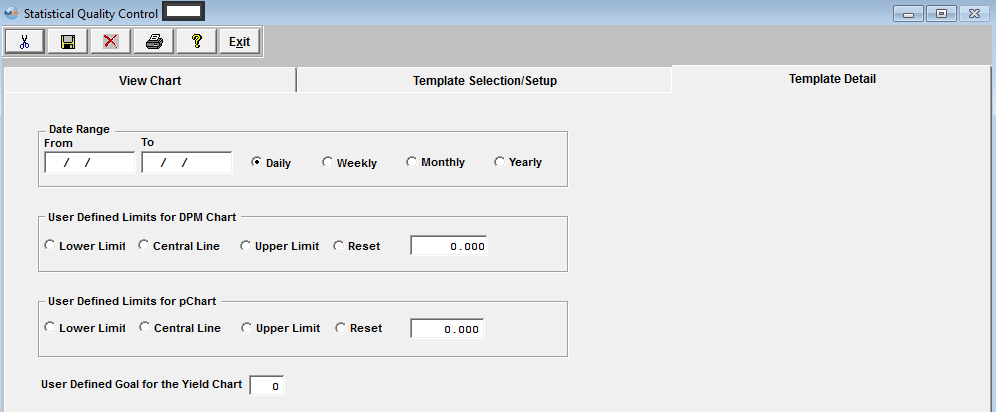
| 1.3.4. Template Detail Tab | ||||||||
Template Detail Tab
|
| 1.4. How To .... for SQC |
| 1.4.1. Enter the Defect Data Information |
All data must be Entered in the Quality Inspection Entry and Defect Information screens, with in the Shop Floor Tracking Module.
|
| 1.4.2. Enter the Defect Data Information for the DPMO by Employee Report |
In order to have the "DPMO by Employee" report create valid data, the user must be sure to enter the opportunities for defects (PPM) in the Work Order Traveler Setup and the employee must inspect the board and be assigned to the defects. The "DPMO by Employee" report only gathers data if BOTH "Inspected By" and "Emp" are the same user, and the PPM is setup. See Article #3156 for further detail on DPMO. The following steps need to be followed to collect and track defects per employee. All data must be Entered in the Quality Inspection Entry and Defect Information screens, with in the Shop Floor Tracking Module.
|
| 1.4.3. SQC - Setup an SQC Template | ||||||||||||||||||||||||||||||
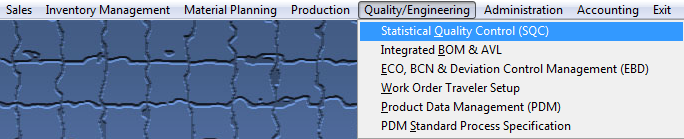
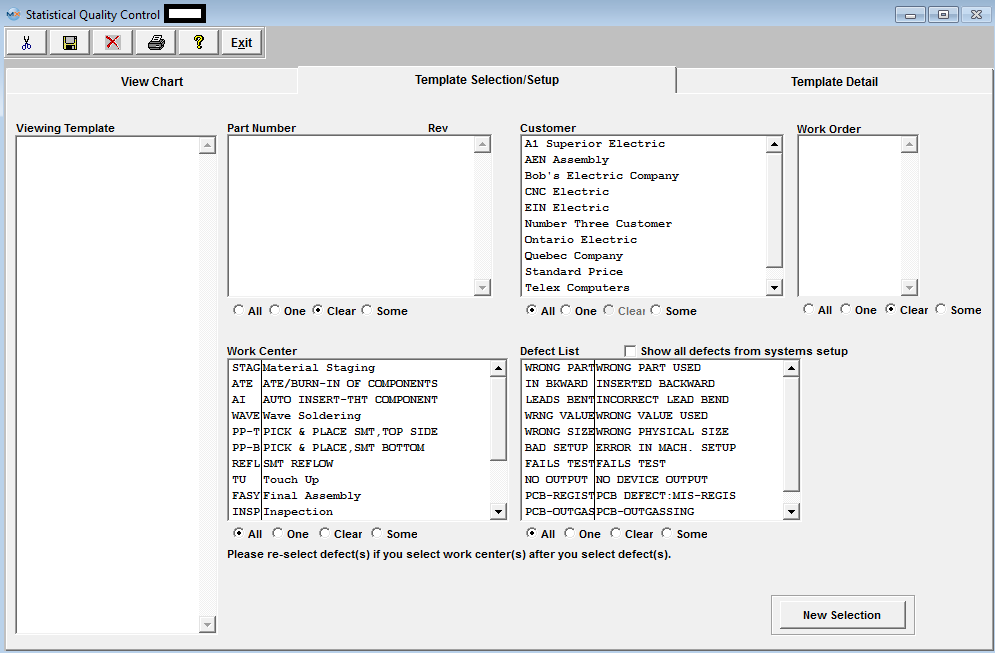
Enter the SQLMANEX.EXE (within the ManEx root directory) The following screen will be displayed, select Quality/Engineering/Statistical Quality Control (SQC) Module The following screen will be displayed:
Template Selection Setup This is the first screen to be used in the module. In this screen, STATISTICAL QUALITY CONTROL graphics are created by selecting parameters to be considered in the graph. This screen operates differently than all other ManEx screens. When bringing up the SQC module, the user is first presented with a template screen from which to choose parameters to be included in the information displayed. When the user enters the system, he/she may select how they want to start the process of selection. Click on the Customer, Part Number or Work Order radial.
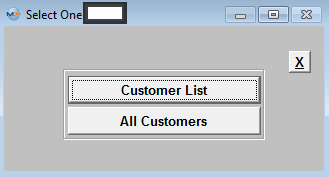
Clicking on the Customer radial will bring up the following selection screen:
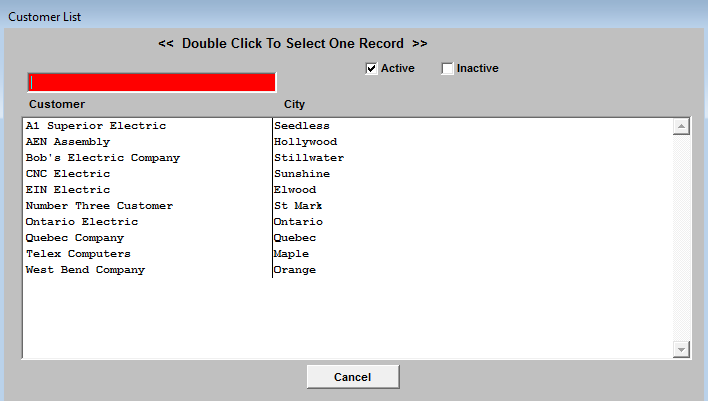
Selecting by Customer List will bring up the following selection screen: Type the Customer into the red box or highlight and double click.
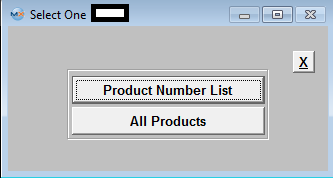
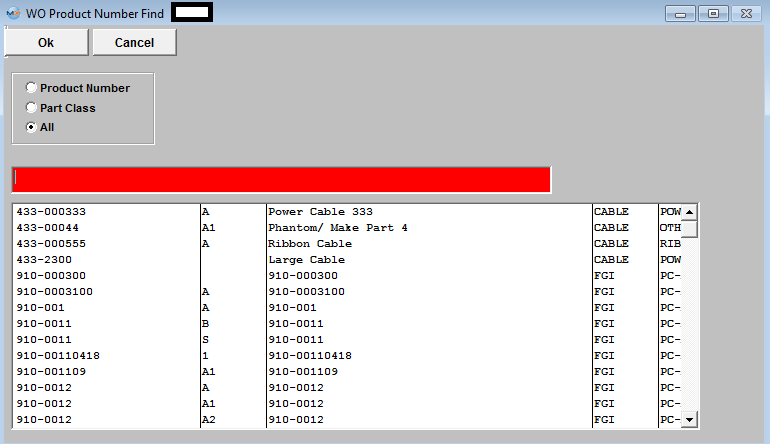
If the user selects Product Number List, the following list will appear: Type the Part Number into the red box or highlight and double click.
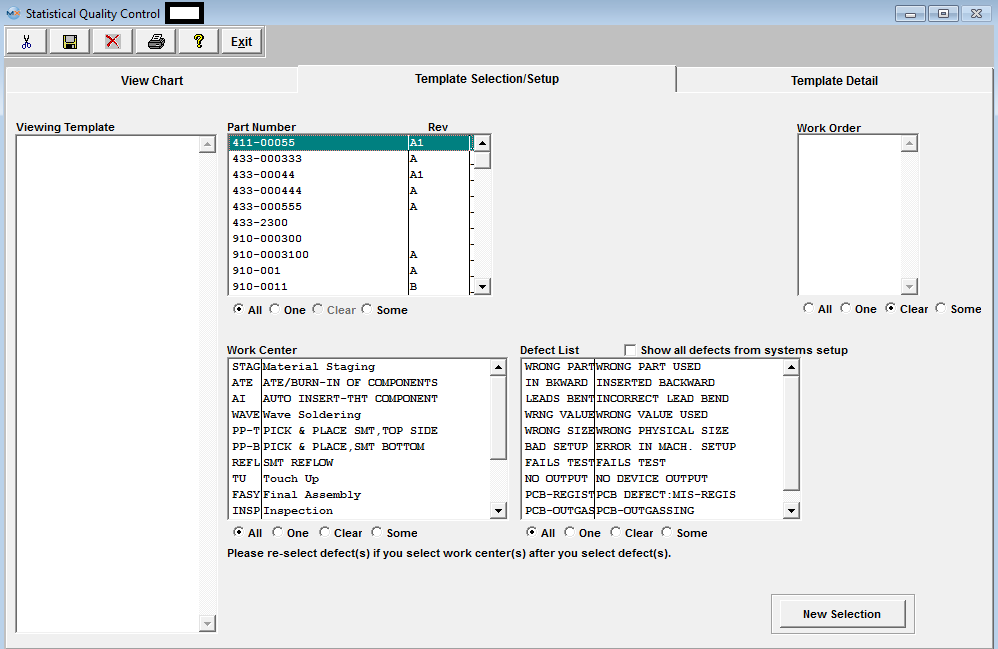
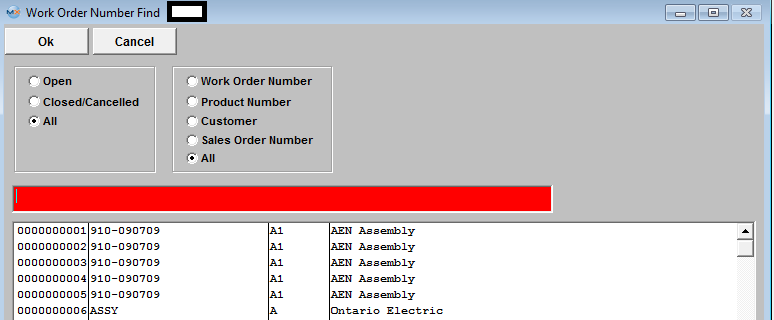
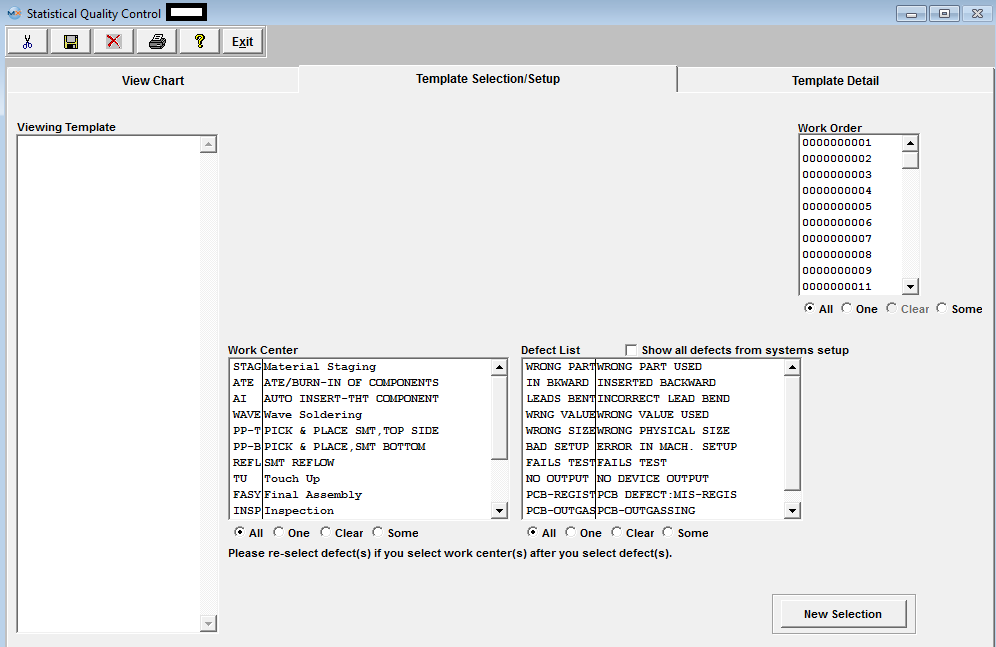
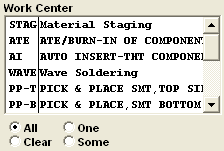
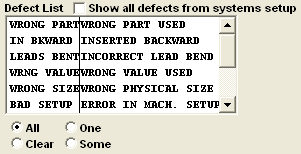
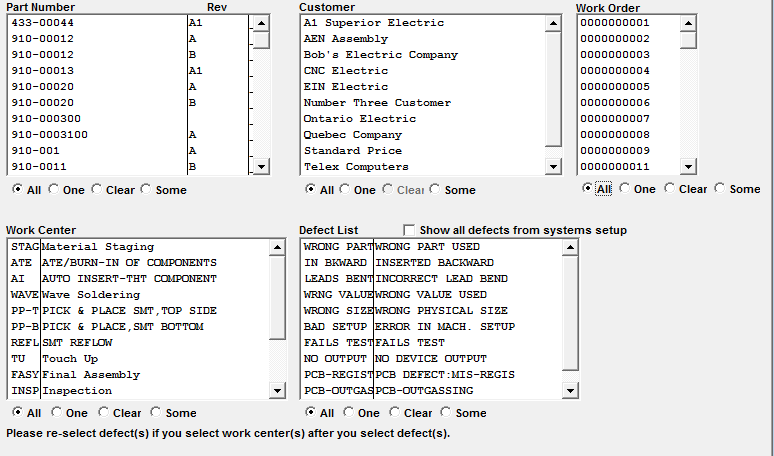
In the Work Order section, choose from All, One or Some. If you’ve selected one, highlight the desired work order. If you want more than one, depress the Ctrl key and click on the ones desired. In the Work Center section, choose from All, One or Some. If you’ve selected one, highlight the desired work center. If you want more than one, depress the Ctrl key and click on the ones desired. Make the same selection in the Defect List section. If you want all defects displaying as per the System Setup, check the Defect List box. To make a new selection, depress the New Selection button. Template Detail Screen Pressing on the Template Detail tab brings up the following screen:
Enter the Date Range, From and To. Mark the Radial for the view by Daily, Weekly, Monthly, or Yearly. Mark the radial for the User Defined Limits for DPMO chart: Lower Limit, Central Line, Upper Limit or Reset. Indicate Central Line amount in box. Mark the radial for the User Defined Limits for pChart: Lower Limit, Central Line, Upper Limit or Reset. Indicate Central Line amount in box. Indicate the user defined goal for the Yield Chart.
To Save this template for future use go back to the Template Selection/Setup tab enter in a name and depress the Save button. The Template will be saved in the Viewing Template field for future use.

|


| 1.4.4. SQC - Data Viewing And Analysis | ||||||||
Enter the SQLMANEX.EXE (within the ManEx root directory) The following screen will be displayed, select Quality/Engineering/Statistical Quality Control (SQC) Module The following screen will be displayed:
Template Selection Setup This is the first screen to be used in the module. In this screen, STATISTICAL QUALITY CONTROL graphics are created by selecting parameters to be considered in the graph. This screen operates differently than all other ManEx screens. When bringing up the SQC module, the user is first presented with a template screen from which to choose parameters to be included in the information displayed. When the user enters the system, he/she may select how they want to start the process of selection. Click on the Customer, Part Number or Work Order radial.
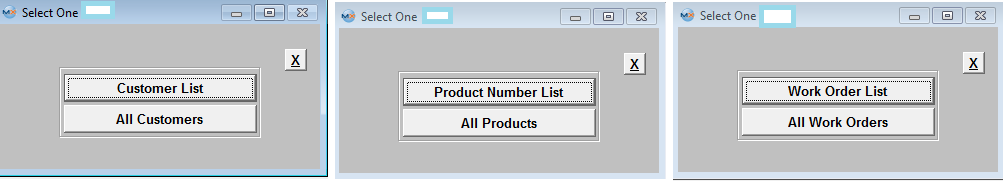 The user then may select to view just a Customer List, Product Number List, Work Order List, or All Customers, All Products, or All Work Orders.
Once they have made their choice, the following screen will appear. Depending on the selection the following screen may differ.
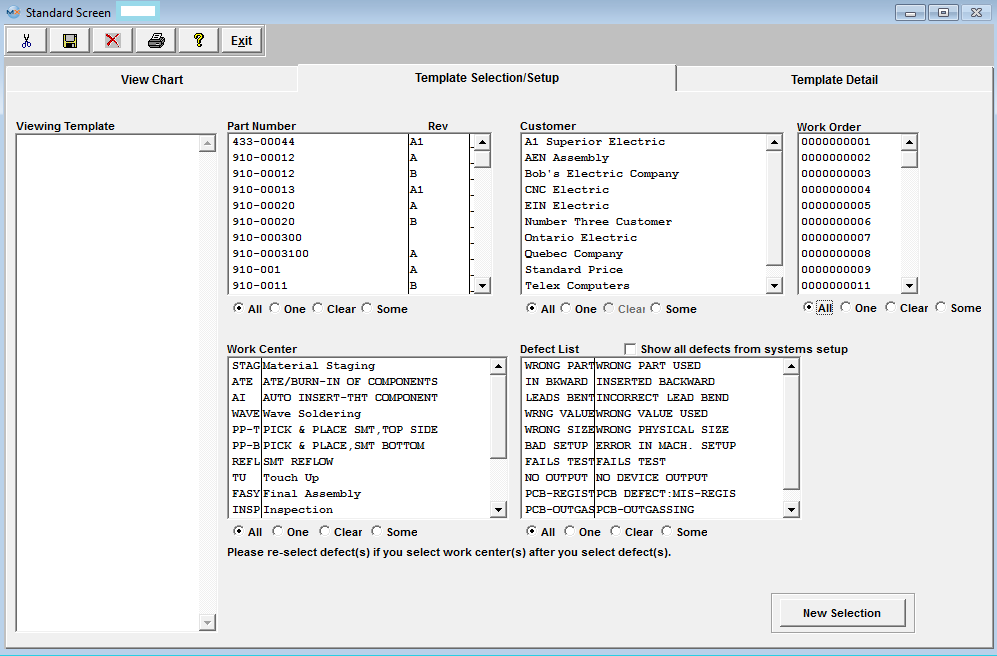
In each section, choose from All, One, Some, or Clear. If you’ve selected one, highlight the desired. If you want some (more than one), depress the Ctrl key and click on the ones desired. To make a new selection, depress the New Selection button. Template Detail Screen Pressing on the Template Detail tab brings up the following screen:
Enter the Date Range, From and To. Mark the Radial for the view by Daily, Weekly, Monthly, or Yearly. Mark the radial for the User Defined Limits for DPMO chart: Lower Limit, Central Line, Upper Limit or Reset. Indicate Central Line amount in box. Mark the radial for the User Defined Limits for pChart: Lower Limit, Central Line, Upper Limit or Reset. Indicate Central Line amount in box. Indicate the user defined goal for the Yield Chart. View Chart Screen/Graphs Pressing on the View Chart brings up the Graphics Display Window. Defect Pareto Chart - The results being displayed in the Pareto Chart are from Several Work Orders combined. Note: The yellow line is a cumulative % of total defects represented by the current defect and all preceding defects. That is why it reaches 100% by the right side of the graph.
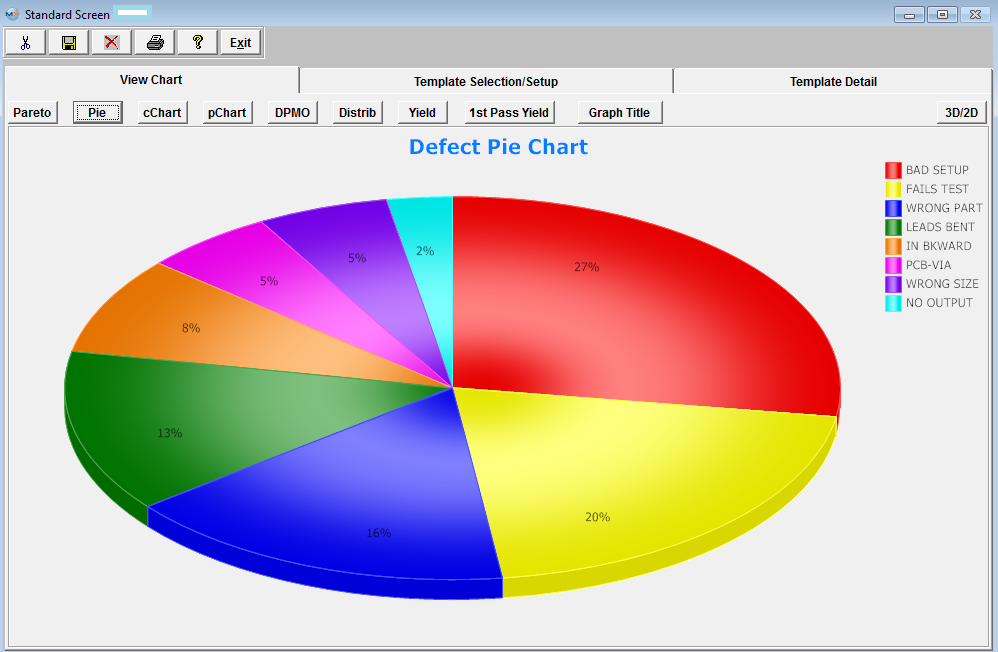
 Defect Pie Chart - The results being displayed in the Defect Pie Chart are from several Work Orders Combined.
 cChart - The results being displayed in the cChart are from all Work Orders, Work Centers, and all defects from 01/01/2012 thru 01/31/2012 (1 month)
The Red Line is the Defect Qty The formula for the Central line (Green line) is: c = Total Defects (divided by) Number of Subgroups The formula for the Upper Control Limit (UCL) (Blue line) = c + 3 (divided by) p The formula for the Lower Control Limit (LCL) (Yellow line) = c - 3 (divided by) p (or 0, whichever is greater)
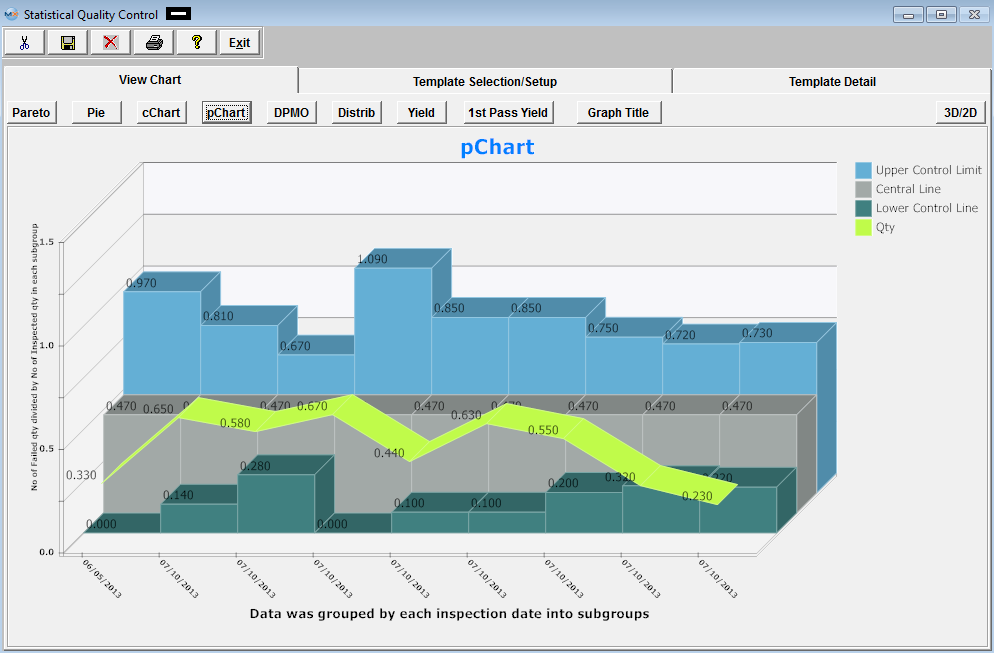
 pCHART The results being displayed in the pChart are from all Work Orders, Work Centers, and all defects for one day 07/10/2013.
The formula for the Central line (Gray) is: p = Total Number Failed (divided by) Total Number Inspected The formula for the Upper Control Limit (UCL) (Blue) = p + 3 (divided by) p (1-p) divided by n The formula for the Lower Control Limit (LCL)(Green) = p - 3 (divided by) p(1-p) divided by n (or 0, whichever is greater)
DPMO (Defects Per Million Opportunities) Chart (Which means the number of things wrong observed in the inspection of a part, or board assembly). The results being displayed in the DPMO Chart are from several Work Orders combined.
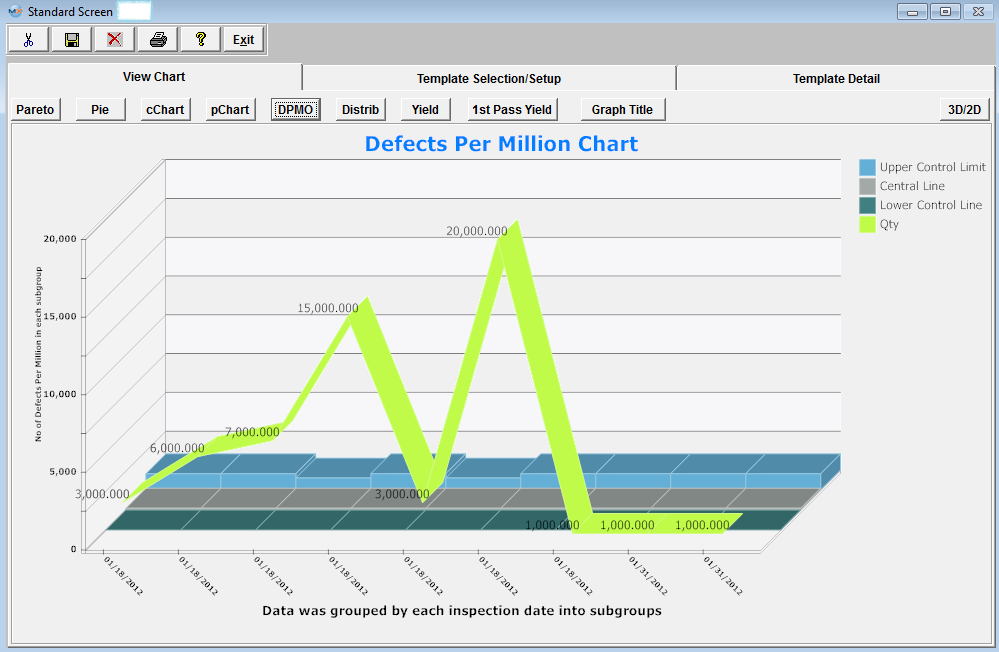 Defects Per Million Opportunities. There are several ways to setup the opportunities (which means the number of possible defects that can occur on a product), but it is up to each company to make that decision. For Example: Some may say that a resistor with two leads that are not properly soldered is counted as two defects and some may only count it as one defect, since it is one part that was assembled incorrectly. The opportunity or the standard opportunity is entered in the Work Order Traveler Setup module. The field is called PPM = Parts per million. The DPMO chart uses the PPM as a reference to measure the actual failures against the total inspected quantity. See Article #3156 for further detail on DPMO. The formula for calculating DPMO chart is as follows: Example (2+3+3) = SUM of defect quantities (8) * opportunities or PPM (1,000,000) (divided by) Qty Inspected (500) (divided by) parts per unit (100) = 160 Daily, Weekly, Monthly, Yearly On the Y axes the graph shows number of defects per million One the X axes day or week or month or year This graph collects defect information for the selected work centers and work orders in the selected date range. The user also has to select if the information will be grouped by day, week, month, or year. The selected group will be your X coordinates on the graph. The Y coordinates will be calculated as sum of the defect quantities *opportunities or PPM divided by total Qty inspected (divided by) parts per unit (qty was entered in the routing module) grouped by X coordinate unit (Daily, weekly, monthly, yearly). This is a data line there is three more control lines displayed on the graph: Central control line: Upper control line: Lower control line All three lines could be user define lines. If the lines are not user define lines they calculated as following Central Line lnCentralLine=lnTotalDef/lnTotalComp, where lnTotalDef is sum of all defect quantities * 1000000 and lnTotalComp is sum of inspected quantities*Parts Per Unit (entered in the routing module) At this time system will decide if it can use average group size or not. If the size group varies more tan 15% the system will use variance Upper and Lowercontrol limit. If average group size could be used the average group size gets calculated by taking lnAvrgSubgrSize=lnTotalComp divided by number of groups and rounded to the nearest integer. Calculation for the Upper Control Line LnUpperLine=ROUND(((3*(SQRT(lnCentrLine*(1000000-lnCentrLine))))/SQRT(lnAvrgSubgrSize)),3) Calculation for the Lower Control Line lnLowerLine = ROUND(lnCentrLine -((3*(SQRT(lnCentrLine*(1000000-lnCentrLine))))/SQRT(lnAvrgSubgrSize)),3) lnLowerLine = IIF(lnLowerLine<0,0,lnLowerLine)
Defects Distribution Chart - The results being displayed in the pChart are from all Work Orders, Work Centers, and all defects from 01/01/2012 thru 01/31/2012 (1 month)
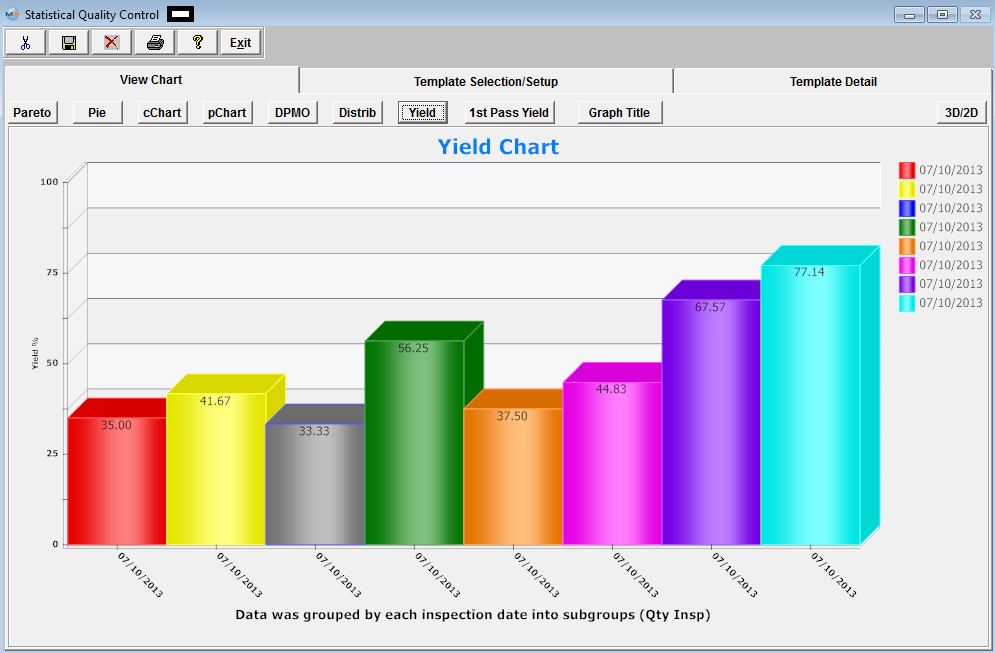
 Yield Chart - "Yield" = Total number of units handled correctly through the process step(s). This is usually measured in a percentage. The results being displayed in the "Yeild Chart" is the ratio of summed inspected qty and summed passed qty, grouped by date (user can select WO number, defect code to be filtered). The results below are from One Work Order, All Work Centers, and all defects for one day 07/10/2013.
1st Pass Yield Chart The results being displayed are from all Work Orders, Work Centers, and all defects from 01/01/2012 thru 01/31/2012 (1 month). 1st Pass Yield chart in the SQC module is designed only when the serial number is used for the work order. The system uses the serial number to determine how many serial numbers passed without failure/defects within a work order. 1st Pass Yield chart will be blank if there are no product tracked by serial number within the production floor 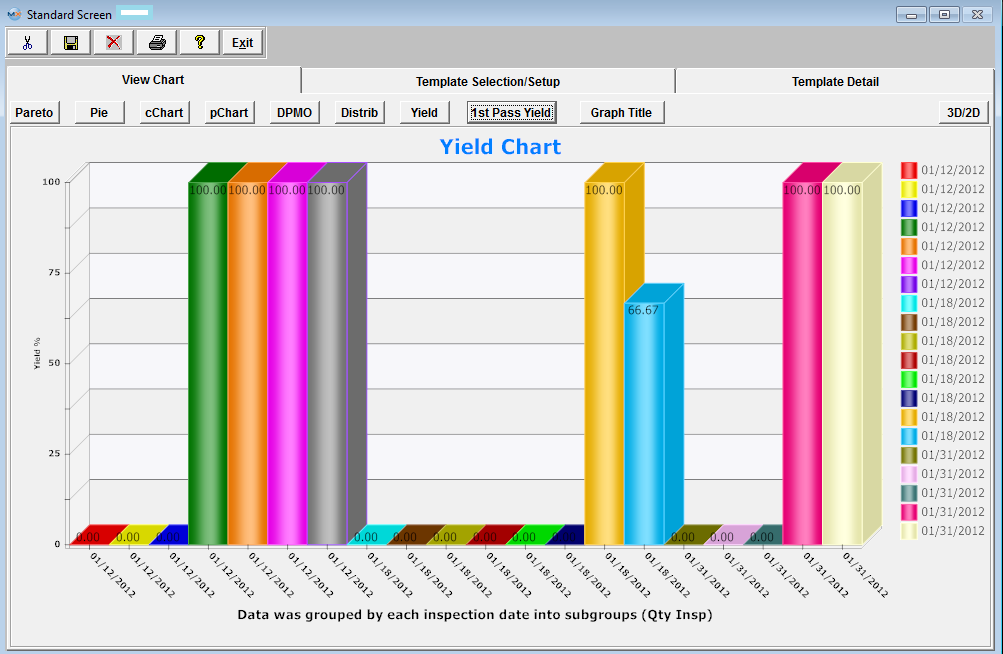
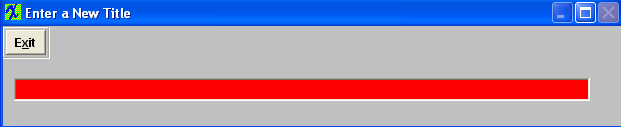
To enter a new title, depress the Graph Title button. The following will be displayed:
Enter in the new desired Graph Title. Depress the Exit button, and the graph title will be updated. 
|
| 1.5. FAQ's for SQC |
| Facts and Questions for the Statistical Quality Control Module |