 |
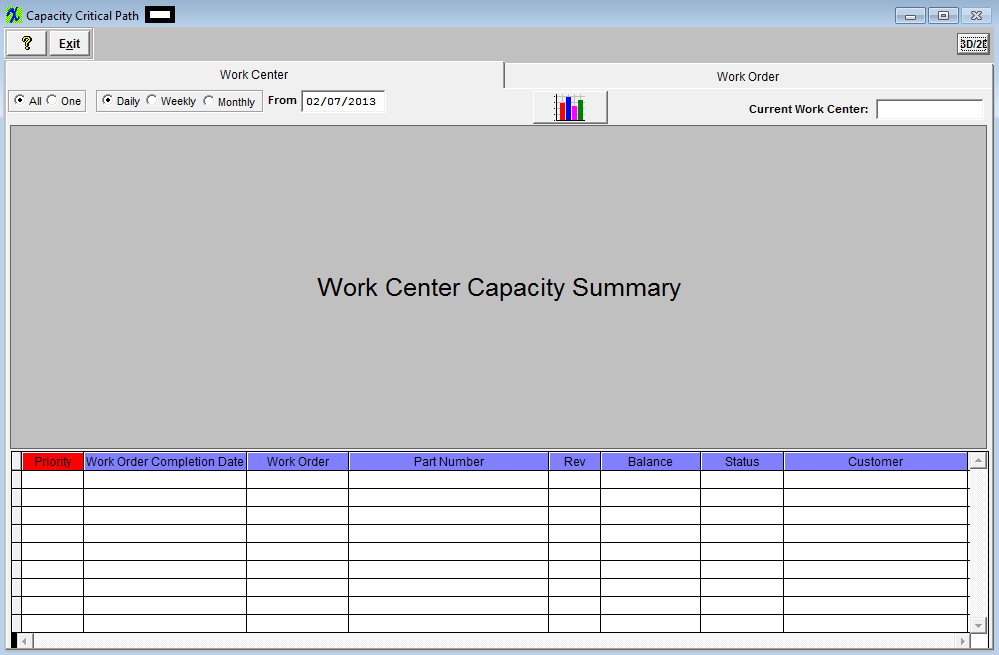
To create a graph, select Work Center(s), by clicking on the appropriate radial. Depress "All" to view the graph for all Work Centers. Depress "One" to view the graph for only one Work Center.
|
 |
Depress the radial to view the period you want the graph to cover, Daily, Weekly or Monthly. Note: It is the capacity and load for 10 (days, weeks, months) The tools tips for the radio buttons shows the explanation
|
| From |
Type in the From date. |
 |
Depress this button to generate the graph.
|
| Current Work Center |
This field will be visible when "All" is selected and will display the current work center being viewed.
|
 |
Depress this button to view the chart in 3D/2C |
| Work Center Capacity Summary |
The graph will be displayed in this section based on the selections. The bar graph will include all jobs that affect the load (including jobs that are on any type of Hold), so users are not misled about the available capacity. The grid below will display the status of the job and if the user feels that a job should not be included they may re-schedule it to a future date. |
| Priority |
This field displays the priority setup in the Work Order screen. |
| Work Order Competion Date |
This field displays the completed date entered in the work order screen.
|
| Work Order |
This field lists the assigned Work Order number.
|
| Part Number |
This feild lists the assigned part number of the assembly being built. |
| Rev |
The revision of the part number of the assembly being built. |
| Balance |
This field displays the balance left to move into FGI. |
| Status |
The status of the Work Order |
| Customer |
This field lists the customer that the assembly is being built for. |
