| 1. Fields & Denfintions for SQC |
| 1.1. Defect Data Collection |
| 1.1.1. Quality Inspection Entry Tab | Quality Inspection Entry Screen Field Definitions
| Work Order Number |
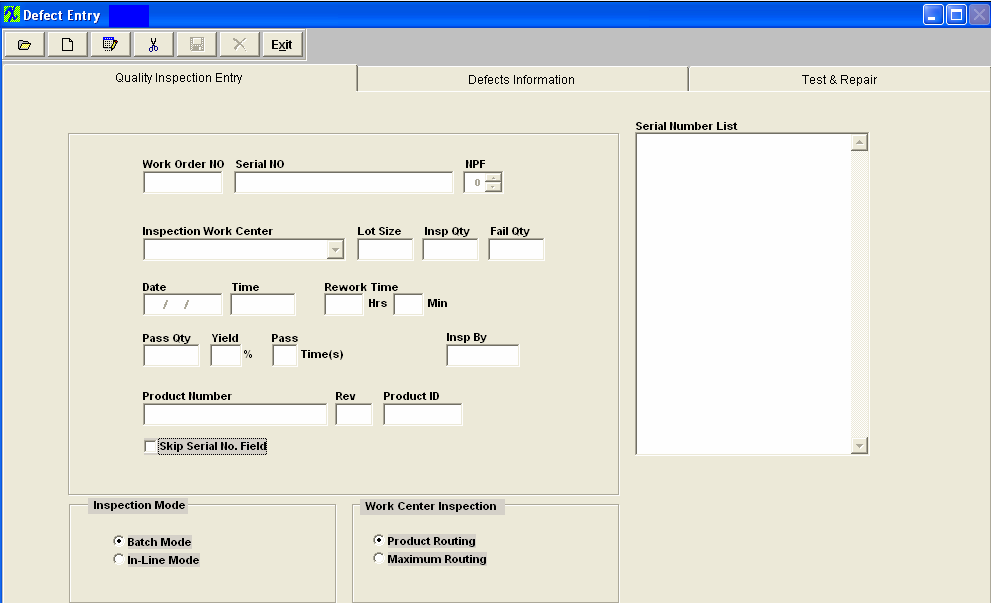
The number of the Work Order which was inspected.
|
| Serial Number |
The serial number assigned to the specific assembly unit.
|
| NPF |
The next field, “NPF”, no problems found, is provided for the user to record when observing the product. If the serial number had previously been rejected, and analysis of the product yield no further problem, either with cosmetics or function, then the user may change this number to 1, meaning the first time it was inspected or tested, no problem was found. If the product serial number is subsequently rejected again, and a second inspection finds a problem, the number may be incremented to a “2”. This will alert users to repeated rejections of a product serial number, one or more times with no discernable defects. If the number of times that a part has experienced an NPF (no of problems found) exceeds that established in the Quality Defect Codes setup, the user will receive a warning message and will allow you to proceed on with the Inspection. This is just a notification that the board has passed the maximum NPF cycle.
|
| Inspection Work Center |
This is the name of the Work Center where the inspection took place.
|
| Lot Size |
This is the number of assemblies available for testing.
|
| Insp Qty |
This is the number ofassemblies actually tested.
|
| Fail Qty |
The number of assemblies which failed inspection.
|
| Date |
The date whereby the inspection took place.
|
| Time |
The time (24 hour clock) when the failure was recorded.
|
| Rework Time |
The time estimated to rework the failed assembly |
| Pass Qty |
The number of assemblies which passed inspection.
|
| Yield |
The percentage of assemblies which passed inspection.
|
| Pass Times |
This is the number of times a particular Serial Number can pass through this Inspection screen. In Quality Defect Code Setup, there is a field called :maximum number of inspections/WC”. The user may define how many times a given serial number can pass through a given Work Center. |
| Product Number |
The internal number assigned to the assembly.
|
| Rev |
The revision number associated with the Product Number.
|
| Product ID |
This field is no longer used and is left blank.
|
| Skip Serial Number Field |
This box is checked if the user wishes to do Without Serial Number Inspection.
|
| Enter Serial Number Without Validation |
Only Enabled if user skips regular serial number entry.
This feature has been added to allow the users the ability to inspect Serial Numbers that do not actually exist within the ManEx system. (for example serial number created outside of ManEx, by customer or other software, etc. . .)If the user checks the “Enter serial number without validation” then ManEx does not validate when the users enters the Serial Number. The system just records the entry for later SQC analysis purpose.(note: if the work order is serialized, then the user can not use this feature)
|
| Inspection Mode |
Determines whether inspection is performed via Batch or In Line mode.
Batch mode is used for entering data previously recorded during inspection of the product. When the user chooses to enter defect data in “In-Line” mode with the serial number, the user won’t be able to enter “lot quantity”, “inspection quantity” or “failed quantity”. These fields are all automatically when the user goes into the “Defects Information” tab. However, if the user enters defect data in “batch” mode without the serial number, then the user will be able to enter “lot quantity”, “inspection quantity” and “failed quantity”.
If the user wishes to 100% inspect material, and directly move the passed material to the next routing work center, then the In-Line Inspection mode may be used.
|
| Work Center Inspection |
The user has the option of viewing defects based on the product routing (Product Routing), or to view all defects (Maximum Routing).
|
| Serial Number List |
The numbers of all of the Serial Numbers which were inspected. Depress the Edit button and then highlight the serial number of choice.
|
|
| 1.1.2. Defect Information Tab | Defect Information Screen Field Defintions
| View |
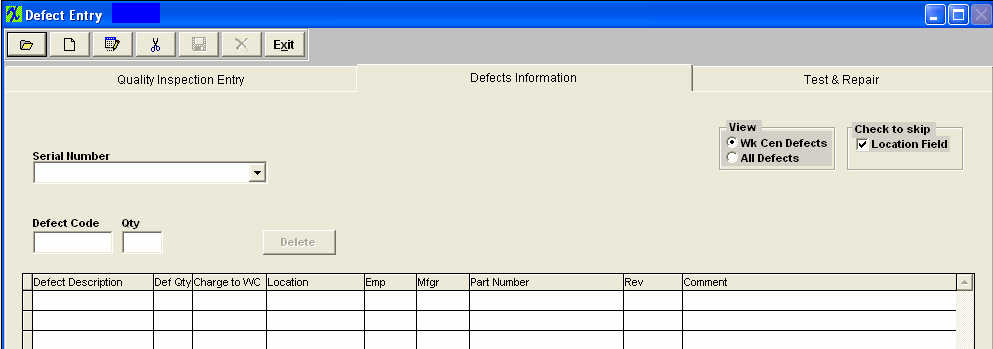
This displays whether the view of the defects is by Work Center only or covers All defects.
|
| Check to skip location field |
If this box is checked, the location field may be skipped.
|
| Serial Number |
The Serial Number of the failed assembly.
|
| Defect Code |
The code used to describe the defect.
|
| Defect Description |
The description of the defect.
|
| Def Qty |
The number of defects.
|
| Charge to WC |
The name of the Work Center where the defect will be charged.
|
| Location |
The Reference Designator as set up in the assembly’s Bill of Materials.
|
| Emp |
Employee number assigned to the defect |
| Mfgr |
The name of the manufacturer of the component.
|
| Part Number |
The internal number assigned to the component.
|
| Rev |
The revision number pertaining to the internal part number.
|
| Comments |
Additional comments entered by the user.
|
|
| 1.2. View Chart Tab | |
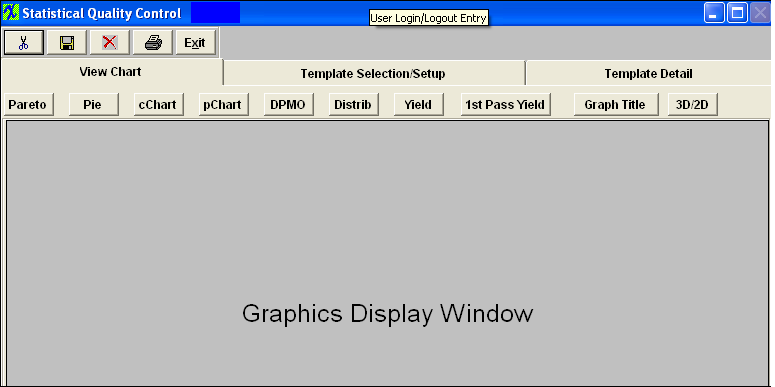
See Article #5082 for more detail on each individual Chart Listed at the Top. Once you have selected the type of graph you wish to view the graph will be displayed in the window below the selection.
|
| 1.3. Template Selection/Setup Tab | |
Template Selection Setup
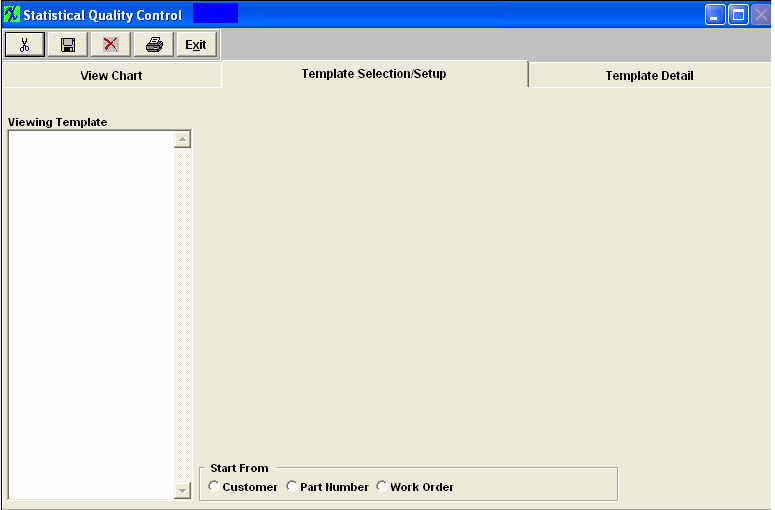
This is the first screen to be used in the module. In this screen, STATISTICAL QUALITY CONTROL graphics are created by selecting parameters to be considered in the graph.
This screen operates differently than all other ManEx screens. When bringing up the SQC module, the user is first presented with a template screen from which to choose parameters to be included in the information displayed.
When the user enters the system, he/she may select how they want to start the process of selection. Click on the Customer, Part Number or Work Order radial.
|
| 1.4. Template Detail Tab | 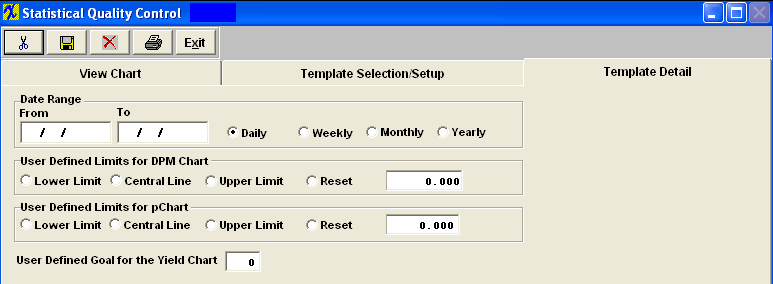
| Date Range |
Enter the Date Range, From and To. Mark the Radial for the view by Daily, Weekly, Monthly, or Yearly. |
| User Defined Limits for DPM Chart |
Central Line
lnCentralLine=lnTotalDef/lnTotalComp, where lnTotalDef is sum of all defect quantities * 1000000 and lnTotalComp is sum of inspected quantities*Parts Per Unit (entered in the routing module)
At this time system will decide if it can use average group size or not. If the size group varies more tan 15% the system will use variance Upper and Lowercontrol limit. If average group size could be used the average group size gets calculated by taking lnAvrgSubgrSize=lnTotalComp divided by number of groups and rounded to the nearest integer.
Calculation for the Upper Control Line
LnUpperLine=ROUND(((3*(SQRT(lnCentrLine*(1000000-lnCentrLine))))/SQRT(lnAvrgSubgrSize)),3)
Calculation for the Lower Control Line
lnLowerLine = ROUND(lnCentrLine -((3*(SQRT(lnCentrLine*(1000000-lnCentrLine))))/SQRT(lnAvrgSubgrSize)),3)
lnLowerLine = IIF(lnLowerLine<0,0,lnLowerLine)
|
| User Defined Limits for pChart |
The formula for the Central line (Red) is: p = Total Number Failed (divided by) Total Number Inspected
Upper Control Limit (UCL) = p + 3 (divided by) p (1-p) divided by n
Lower Control Limit (LCL) = p - 3 (divided by) p(1-p) divided by n (or 0, whichever is greater)
n = number inspected (sample size)
|
| User Defined Goal for the Yield Chart |
"Yield" = Total number of units handled correctly through the process step(s). This is usually measured in a percentage. The results being displayed in the "Yeild Chart" is the ratio of summed inspected qty and summed passed qty, grouped by date (user can select WO number, defect code to be filtered). |
|
|
