|
To display or print a Report from the Statistical Quality Control (SQC), module. Enter the module.
1. To access the reports, depress the Print action button at the top of the screen. The report screen will appear.
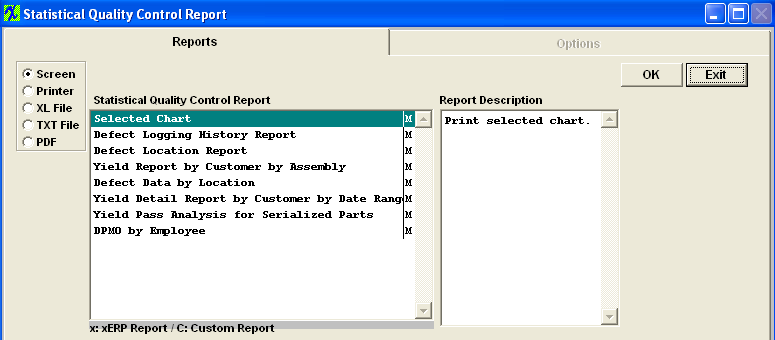
2. Select the output you desire by selecting one of the output radial selections at the top left of the screen, Screen, Printer, XL File, TXT File, or PDF.
3. Highlight the report desired and click on the option tab (if applicable).
Selected Chart report
If you want to print the selected chart, the chart you want to print must be displaying in the View Chart tab. The same exact chart viewed on screen will be printed.
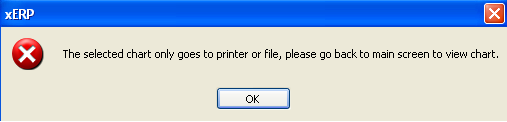
Depress the OK button, and you will receive the following message. The selected chart only goes to printer or file, please go back to main screen to view chart.
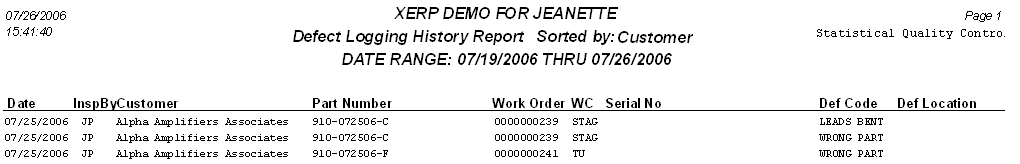
Defect Logging History report
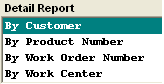
| If you select Defect Logging History Report, you will be asked to select the sort.
Select one of the following:Customer, Product Number, Work Order Number or Work Center.
|
 |
|
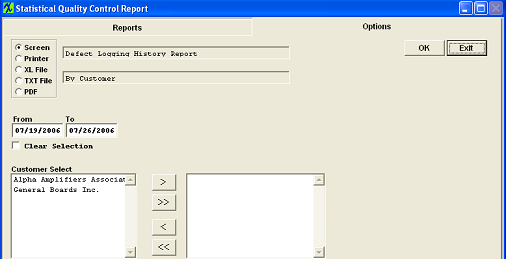
Select the date range. Highlight the Customer desired. Depress the > button. If you want all customers, depress the >> button.
Depress the Ok button.
|
 |
The following report will print:
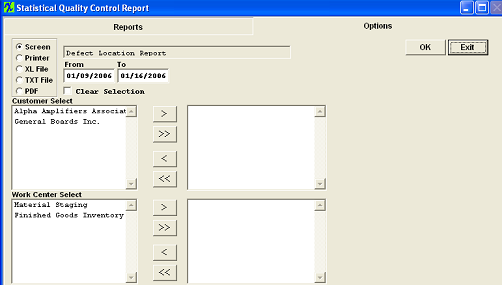
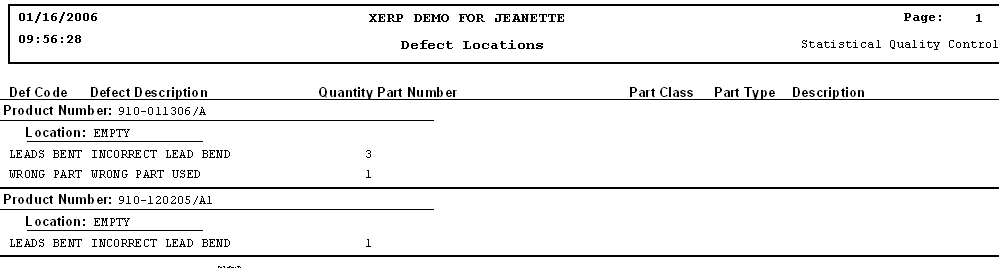
Defect Location report
|
Select the date range. Highlight the Customer desired and depress the > button. If you want all customers, depress the >> button. Highlight the Work Center and depress the > button. If you want all Work Centers, depress the >> button.
Depress the OK button.
|
 |
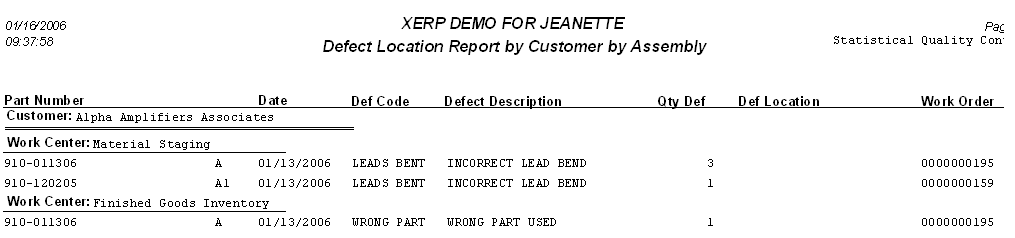
The following report is available:
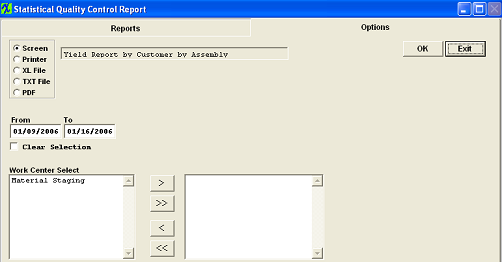
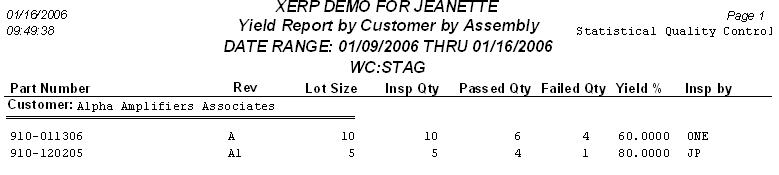
Yield Report by Customer by Assembly report
|
Select the date range. Highlight the Work Center and depress the > button. If you want all Work Centers, depress the >> button.
Depress the OK button.
|
 |
The following report will print:
Defect Data by Location report
First you must enter data in Template Selection/Setup and Template Detail Screen. Then depress the Print action button, Highlight the Defect Data by Location report and depress the Ok button.
The following report will print:
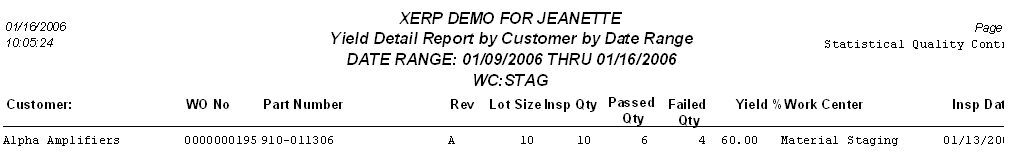
Yield Detail Report by Customer by Date Range
|
Select the Date Range. Click on the desired radial to select Open Work Orders only or All Work Orders. Highlight the Work Order desired and depress the > button. If you want all Work Orders, depress the >> button. Highlight the Work Center and depress the > button. If you want all Work Centers, depress the >> button. Highlight the Customer desired and depress the > button. If you want all customers, depress the >> button.
Depress the OK button
|
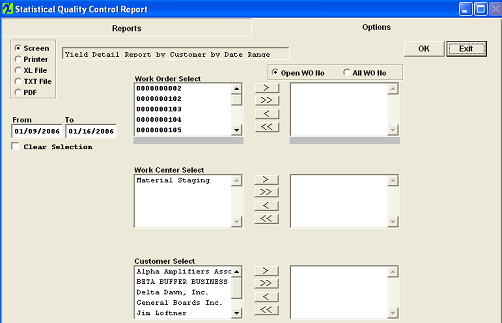 |
The following screen will appear:
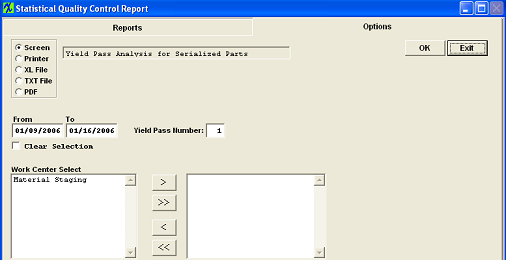
Yield Pass Analysis for Serialized Parts report
|
Select the Date Range. Type the Yield Pass Number. Highlight the Work Center and depress the > button. If you want all Work Centers, depress the >> button.
Depress the OK
|
 |
The following report will print:
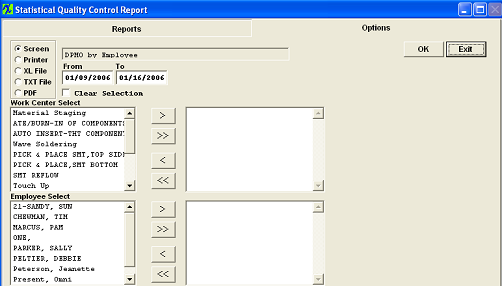
DPMO by Employee
| Select the Date Range. Highlight the Work Center desired and depress the > button. If you want all Work Centers, depress the >> button. Highlight the Employee and depress the > button. If you want all Employee's, depress the >> button.
Depress the OK button.
DPMO = Number of defect * opportunities or PPM (1,000,000) (divided by) Qty Inspected (divided by) parts per unit
In order to make this report data valid, the employee must inspect the board and be assigned to the defect. For more information see Article #1776.
|
 |
For Example: the PPM for each work center is:
Work center PPM
STAG 2
SMT 1
FGI 5
SCRP 3
User ONE inspect two records in Defect code entry module:
1) Insp Qty 10, Work Center: STAG
Defec detail:
Defect Code Chg WC Defect Qty Emp
Defect-1 STAG 2 ONE
Defect-2 SMT 1 JM
Defect-3 STAG 5 ONE
2) Insp Qty 20, Work Center: SMT
Defect Detail:
Defect Code Chg WC Defect Qty Emp
Defect-4 SMT 1 ONE
Defect-3 SMT 4 ONE
Defect-6 WAVE 7 MP
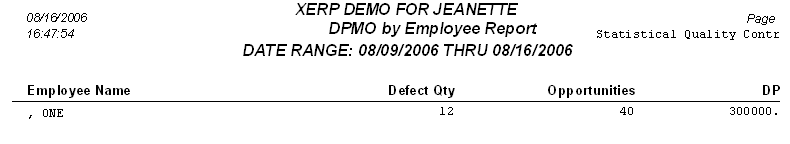
If user selects all work centers (on report option page)
The Defect Qty for ONE will be 2+5+1+4 = 12
Number of Unit*Number of opportunities = 2*10+1*20=40
DPMO for User ONE is 12*1,000,000/40=300,000
As displayed:
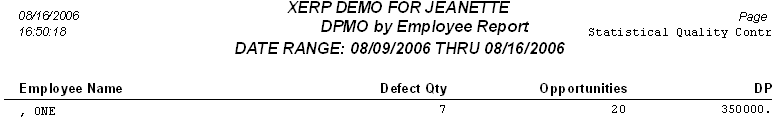
The user has option to select for certain work centers, for example, if user only selects for "STAG" work center, then
The Defect Qty for ONE will be 2+5 = 7
Number of Unit*Number of opportunities = 2*10=20
DPMO for User ONE is 7*1,000,000/20 = 350,000
As displayed:
|