| Template Detail Tab |
Template Detail Tab
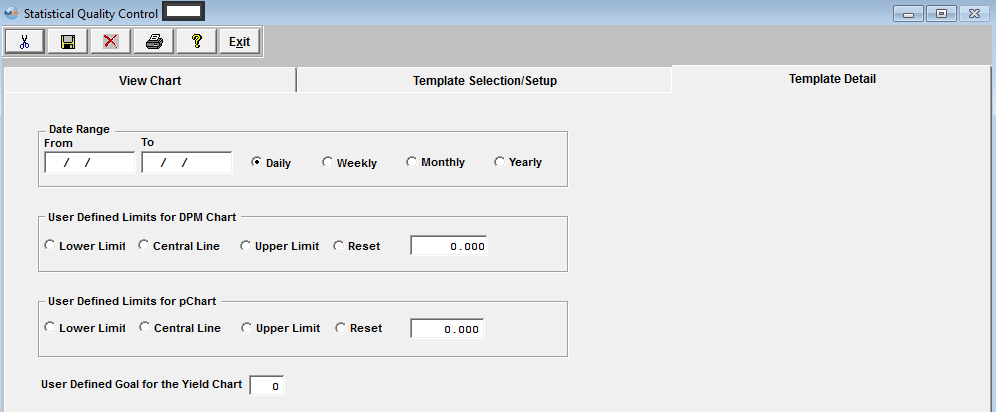
| Date Range |
Enter the Date Range, From and To. Mark the Radial for the view by Daily, Weekly, Monthly, or Yearly. |
| User Defined Limits for DPM Chart |
Central Line
lnCentralLine=lnTotalDef/lnTotalComp, where lnTotalDef is sum of all defect quantities * 1000000 and lnTotalComp is sum of inspected quantities*Parts Per Unit (entered in the routing module)
At this time system will decide if it can use average group size or not. If the size group varies more tan 15% the system will use variance Upper and Lowercontrol limit. If average group size could be used the average group size gets calculated by taking lnAvrgSubgrSize=lnTotalComp divided by number of groups and rounded to the nearest integer.
Calculation for the Upper Control Line
LnUpperLine=ROUND(((3*(SQRT(lnCentrLine*(1000000-lnCentrLine))))/SQRT(lnAvrgSubgrSize)),3)
Calculation for the Lower Control Line
lnLowerLine = ROUND(lnCentrLine -((3*(SQRT(lnCentrLine*(1000000-lnCentrLine))))/SQRT(lnAvrgSubgrSize)),3)
lnLowerLine = IIF(lnLowerLine<0,0,lnLowerLine)
|
| User Defined Limits for pChart |
The formula for the Central line (Red) is: p = Total Number Failed (divided by) Total Number Inspected
Upper Control Limit (UCL) = p + 3 (divided by) p (1-p) divided by n
Lower Control Limit (LCL) = p - 3 (divided by) p(1-p) divided by n (or 0, whichever is greater)
n = number inspected (sample size)
|
| User Defined Goal for the Yield Chart |
"Yield" = Total number of units handled correctly through the process step(s). This is usually measured in a percentage. The results being displayed in the "Yeild Chart" is the ratio of summed inspected qty and summed passed qty, grouped by date (user can select WO number, defect code to be filtered). |
|
|
|
|
|
|
|
|
|
| Article ID: 5110 |